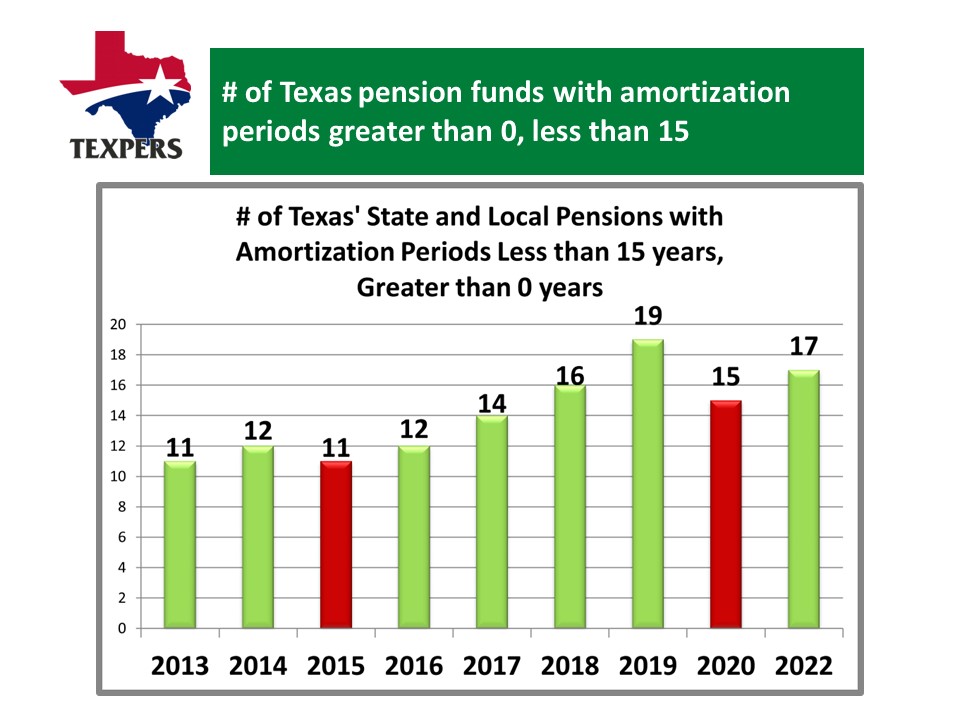
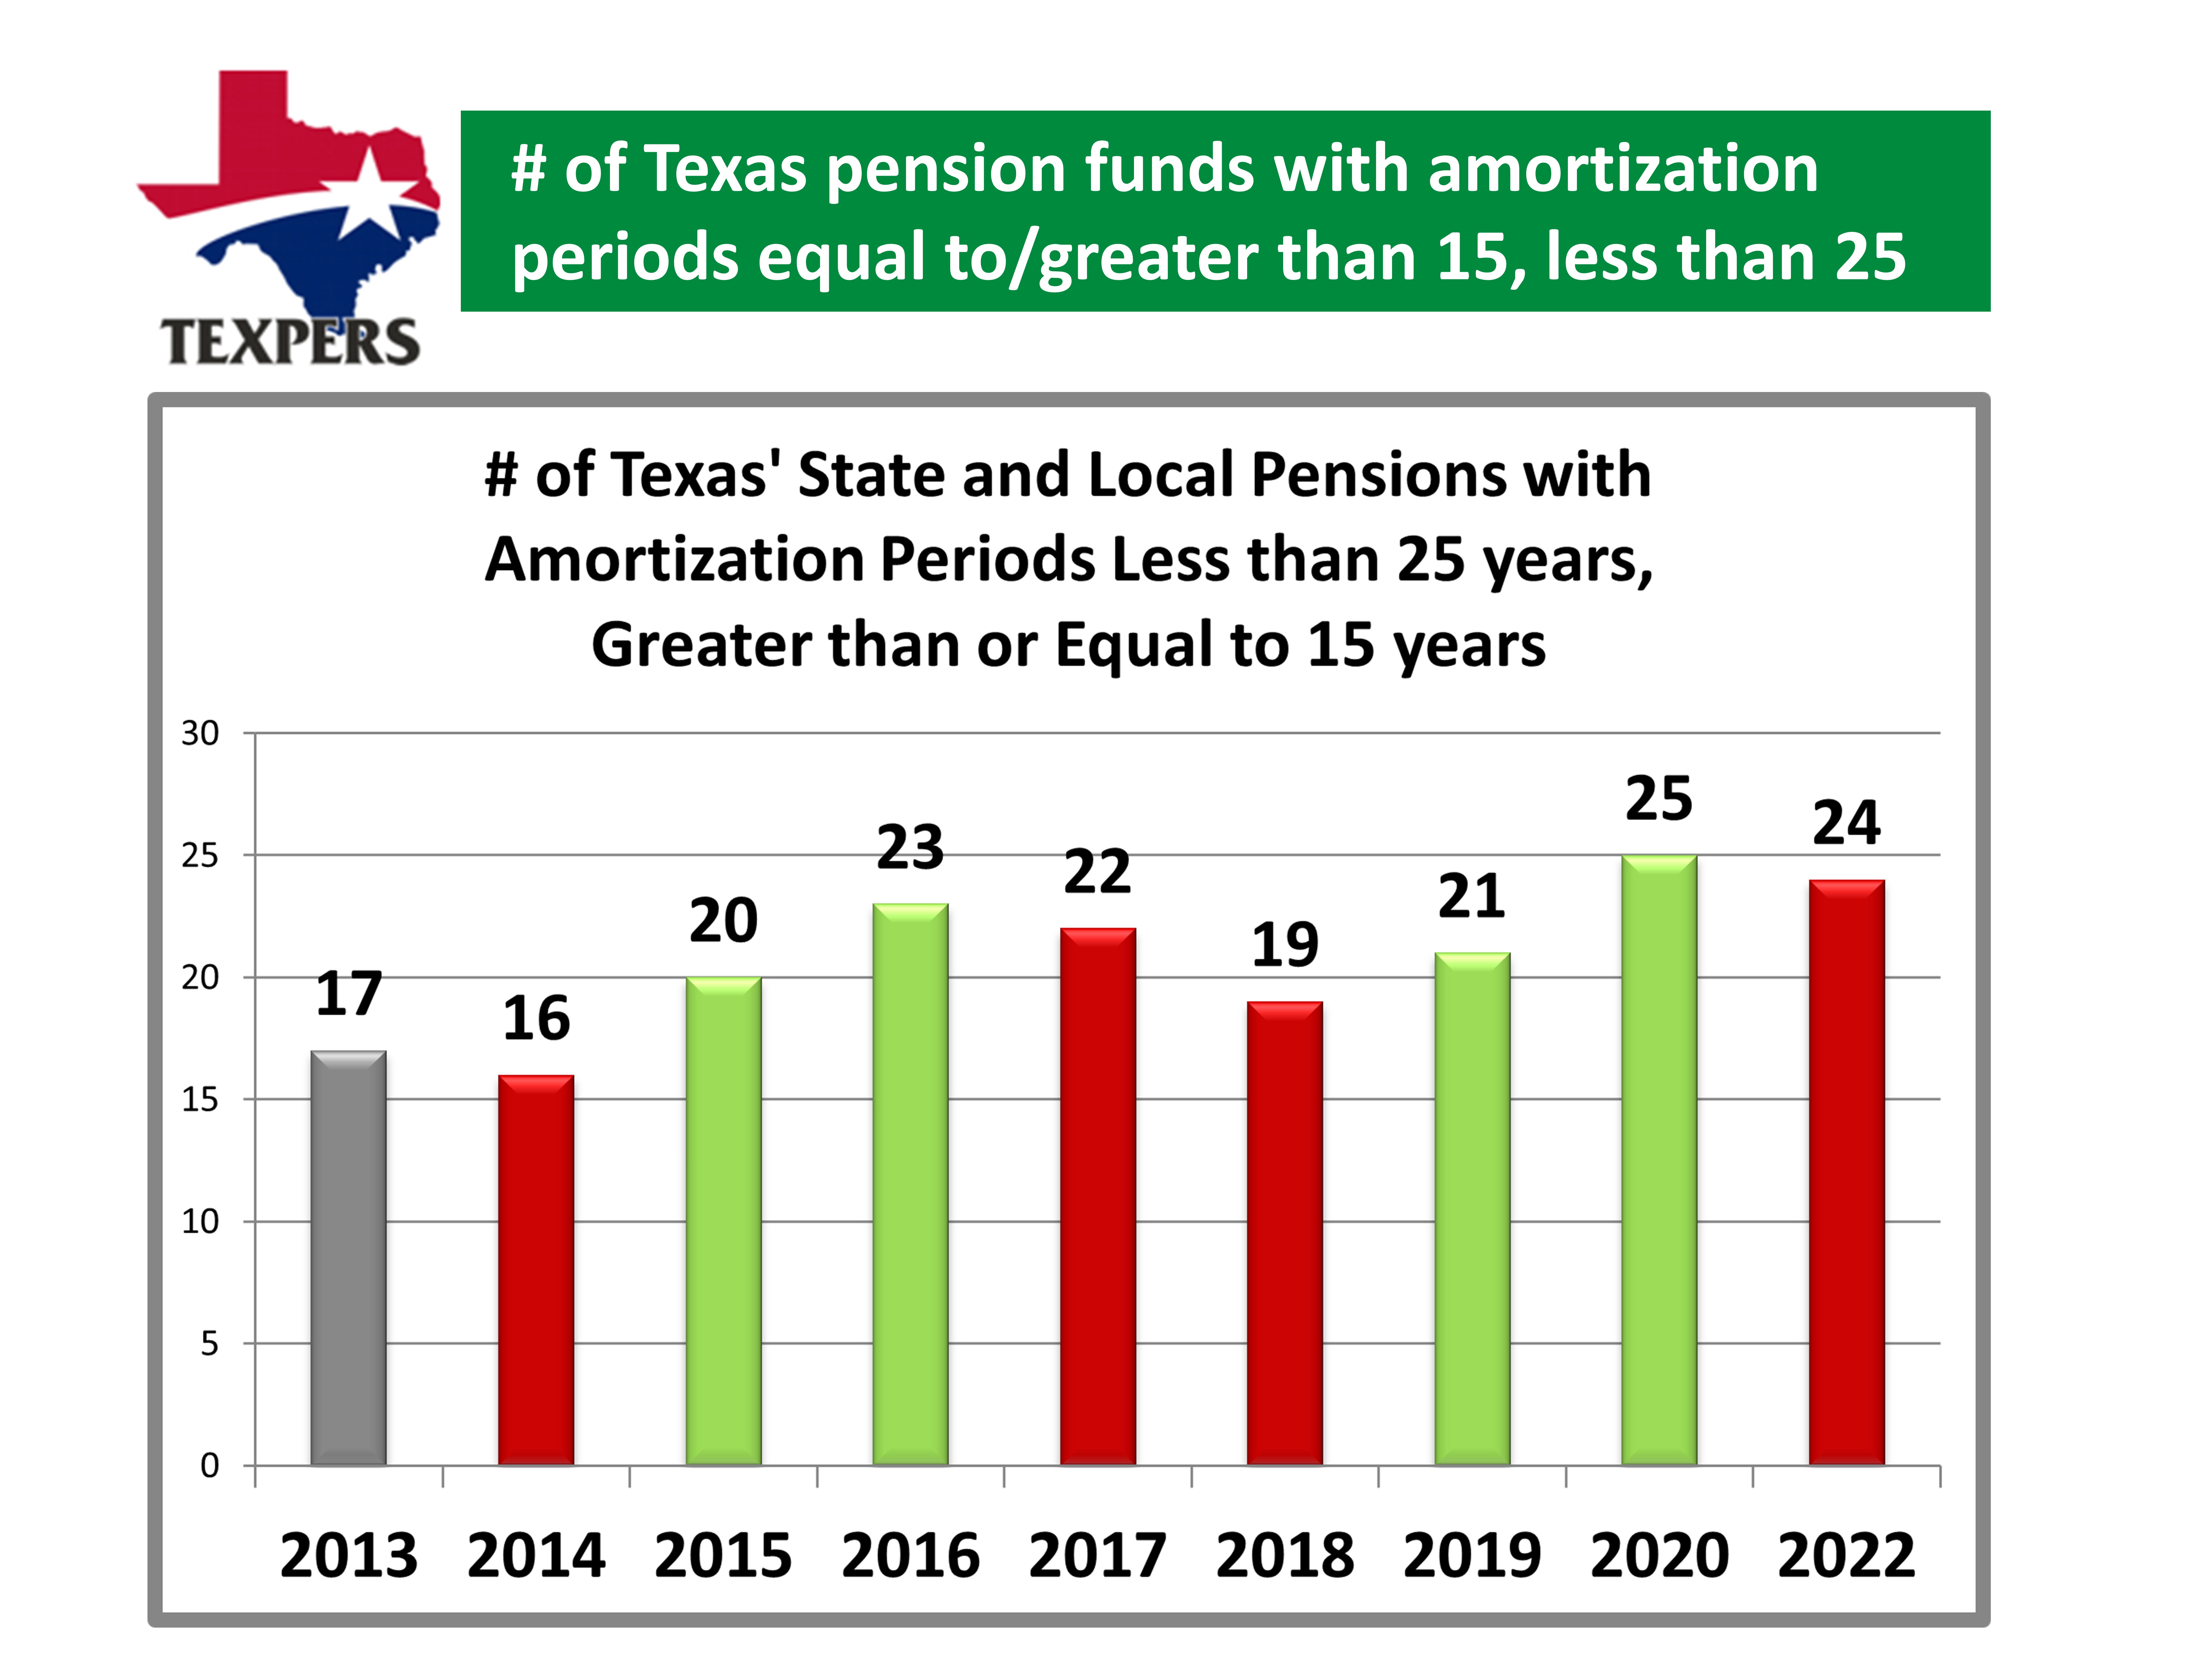
2022 Amortization Period Trend Charts  On the following charts, green bars indicate improvement from the previous year, red bars indicate decline from previous year, and a grey bar indicates no change. For the first three charts, improvements mean that there are more systems in the category. For all the following charts, any increase in number indicates a decline from the previous year. In some cases however, declines can also mean that those systems improved into a lower amortization period.
      |