Goldman Sachs recently released a chart depicting the low or negative correlation between stocks and bonds we have seen over the past few decades. This has been attributable to the low inflationary regime over the period. This makes perfect sense given monetary policy's operation over the last twenty-five years. Counter cyclical policy is very effective in periods of low and stable inflation. When equity markets become concerned about recessions ahead, earnings expectations reduce and valuation multiples contract. Stock prices fall. Bond markets typically would then anticipate the increased chance of the standard monetary policy response; cutting interest rates to spur economic growth. Bond prices rise.
That explains the light blue dots below in Goldman Sachs' chart (Exhibit 2). The dual mandate was really a single mandate on unemployment, as the inflation side of the mandate was not biting.
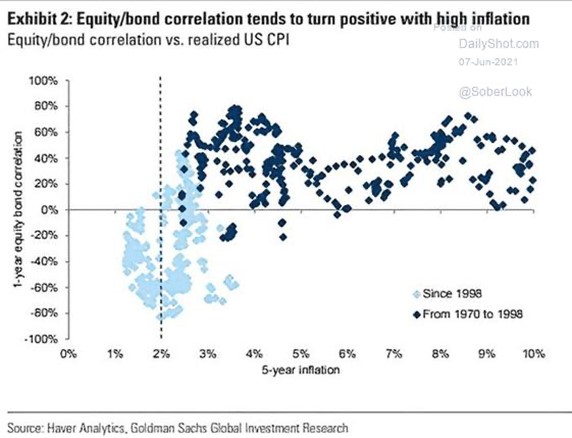
On the other hand, periods of higher inflation have historically resulted in positive correlation between stocks and bonds, represented by the dark blue dots above. During periods of higher inflation, you tend to see rising interest rates, knocking bond prices down and putting pressure on equity multiples. It is much harder for monetary policy to operate in higher inflation environments to combat slowdowns, as the option of cutting interest rates is less easy. The two sides of the dual mandate are in conflict.
Sounds a bit like 2022. High inflation led to a more rapid rise in interest rates than expected, doing a lot of damage to long term bonds that were trading at very low levels – the US10 year ended 2021 at 1.50%. Equity valuation multiples were repriced lower as rates went higher. Stocks and bonds both went down. Portfolios built using bonds to diversify stocks, sometimes with leverage, saw some of the worst returns in decades.
While the long side of the return distribution has dominated since 1998, a return to higher inflation expectations, as seen from 1970 to 1998, requires the investor to consider the other side of the distribution when considering diversifying strategies.
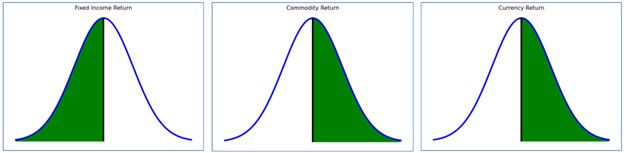
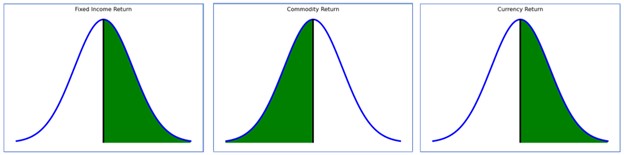
Portfolios just relying on bond returns helping when stocks are falling are looking for the green side of the schematic bond return distribution below. This worked beautifully for many years, until 2022.
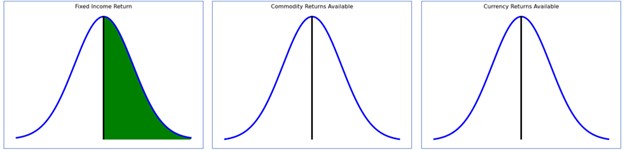
Source: Mount Lucas Management
Managed Futures strategies have more tools available. The left side of the distribution above is not available to long only investors. Managed Futures strategies, given they can take both long and short positions, have both sides available. If bonds trend downwards, short positions can capture it and produce returns to diversify stocks. They also provide access to other asset classes, from both the long and the short side, in commodities and currencies. In our example here, Managed Futures can provide 6 ways to potentially diversify instead of just one.
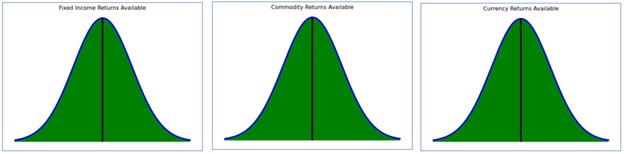
Source: Mount Lucas Management
In 2022, access to additional return distributions were strong contributors to the positive Managed Futures returns that diversified equity and credit markets. It stands to reason why – in times of rising inflation and rising interest rates, getting direct exposure to commodity prices and currency moves gets directly to the issues facing equity investors. The schematic below shows which sides did well in 2022, and then below that how different it was in 2008, when long bonds and short commodities were the right places to be to diversify equity and credit portfolios, alongside the USD length again. The combination of this adaptability and broader toolset is what makes Managed Futures so compelling as a diversifying strategy to us. Why rely on just bonds going up to diversify, when so many other things, both long and short can also fulfil the role.
In 2022…short bonds, long commodities, long the USD was right…
Source: Mount Lucas Management
In 2008…long bonds, short commodities, long the USD was right…
Source: Mount Lucas Management
About the Author:David Aspell is a portfolio manager at Mount Lucas Management LP. Aspell joined Mount Lucas in 2011. Prior to joining the firm, he spent approximately six years at Man Group as a Senior Risk Manager, working in London, New York and Chicago. At Mount Lucas, Aspell served as Chief Risk Officer until 2013, at which point he assumed the role of a discretionary Portfolio Manager in the MLM Macro strategy. In addition to his portfolio management duties, he plays an integral role in the investment research process. Aspell graduated from Sheffield Hallam University and holds a master’s degree in finance from the University of Nottingham (UK). He is a partner in the firm and currently serves as a Senior Portfolio Manager.
Disclosures:Mount Lucas is an Associate Member of TEXPERS. The views expressed are those of the author and do not necessarily represent those of TEXPERS.This commentary is intended for INFORMATIONAL PURPOSES ONLY. This material contains the opinions of the manager, and such opinions are subject to change without notice. This commentary does not constitute an offer to sell or a solicitation of an offer to buy securities and should not be considered as investment advice or a recommendation of any particular security, strategy or investment product. Any offer for an interest in a fund sponsored by Mount Lucas Management LP (“Mount Lucas”) will be made only pursuant to an offering memorandum of such fund.